Energy data has become one of the most important inputs for organisations seeking lower costs, more efficient operations, and better decision-making. Still, many experience being overwhelmed by numbers without extracting real value from them. The data exists, but control is missing.
In this article, we look at what energy data is, why it is often underutilised, and how you can step by step move from raw data to value-creating insights by using structured energy data and modern EMS-systems.

What is energy data - and why is it often underutilised?
Energy prices are more volatile than before. Requirements for energy efficiency in commercial buildings and similar facilities are increasing. Authorities and the market expect documentation of energy consumption and implemented measures. This applies, among other things, through stricter energy requirements in the Norwegian building regulations (TEK17). At the same time, buildings, infrastructure, and industrial processes generate enormous amounts of data on energy consumption.
The challenge is not the lack of available data, but the lack of structure, overview, and active use. Without control, this data becomes historical figures instead of a tool for continuous improvement.
What does energy data consist of in practice?
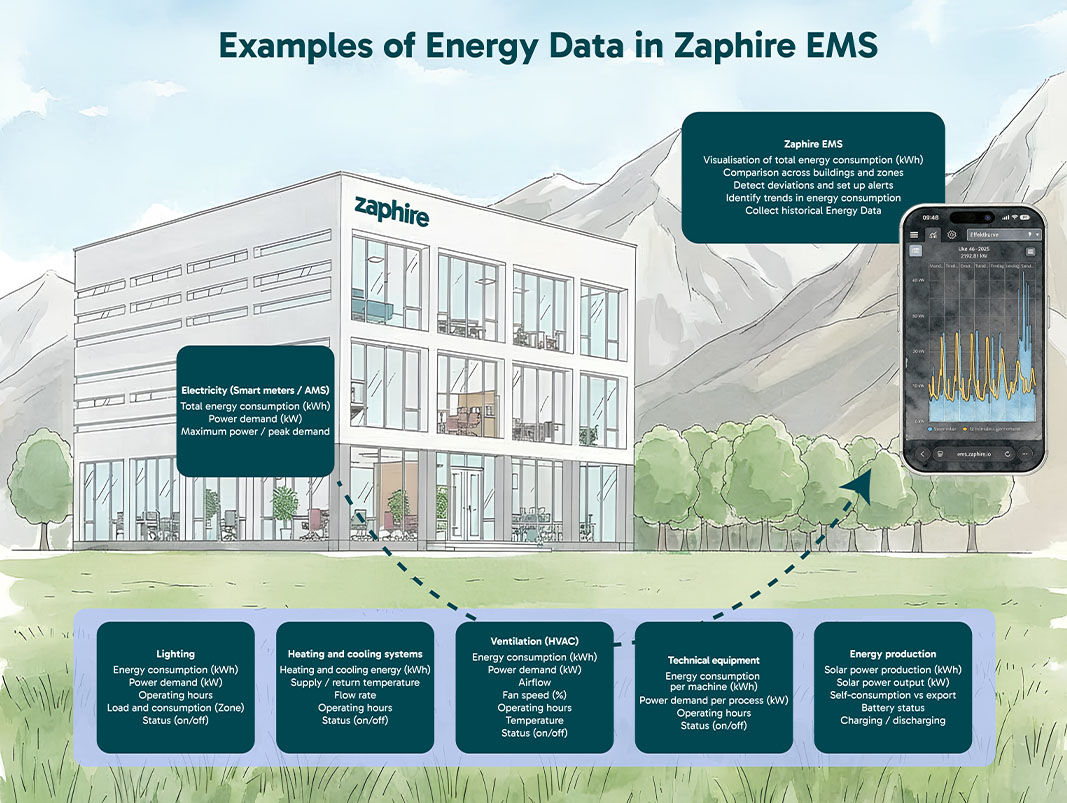
Energy-related data includes all information that describes energy consumption and flows. This may include:
- Metering data from smart meters (AMS) and sub-meters
- Real-time data from sensors and IoT devices
- Historical data for electricity, heating, cooling or gas
- Load profiles, peak demand and time series
However, many organisations collect large volumes of consumption data and still face significant practical challenges. Data is often spread across multiple systems and data silos, quality may vary due to missing values and gaps in measurement series, and the focus is frequently on data collection rather than analysis. In addition, ownership and responsibility for energy data is often unclear. As a result, organisations rarely use the data actively in daily operations or decision-making.
How to gain control - step by step
To gain real control of their energy insights, organisations must do more than collect measurements. Organisations must structure, quality-assure and contextualise data before using it for analysis and decision support. By working systematically with energy data, organisations can move from fragmented figures to holistic insight using an EMS system. The steps below show how to build this control, from the right data foundation to active use of energy data in operations and strategic decisions.
Step 1: Collect the right energy data - not just more data
Effective control starts with collecting relevant data. It can be tempting to measure everything, but more data does not automatically lead to better insights. It is therefore important to ask questions such as:
- What do we want to manage or improve?
- At what level do we need data – building, zone, equipment or process?
- Are hourly values sufficient, or is real-time data required?
Therefore, the right resolution and context are crucial for extracting meaningful insights. Energy data without a clear connection to buildings, processes or activities quickly loses much of its value.
Step 2: Structure and data quality - the foundation for control
Before analysis and visualisation, organisations must ensure energy data is reliable and comparable. This includes identifying missing values and errors, ensuring consistent units and time intervals, and establishing standardised naming of measurement points. It is also important to ensure that the same structure and logic are applied across buildings and facilities. Therefore, high data quality enables automation, energy monitoring and advanced energy analysis. Without this, both reports and decisions become unreliable.
Step 3: From raw measurements to actionable insight
Once the data is structured and quality-assured, it can begin to create value. To ensure accurate comparisons over time, organisations must account for external factors such as temperature and climate. By using weather normalisation in energy monitoring, energy data can be adjusted for weather effects, enabling analyses that provide a more accurate picture of actual energy consumption and the impact of implemented measures.
- Through energy analysis in an EMS system, you can for example:
- Detect abnormal energy consumption and deviations
- Identify energy waste and inefficient processes
- Analyse load profiles and peak demand
- Compare consumption over time, across buildings or facilities
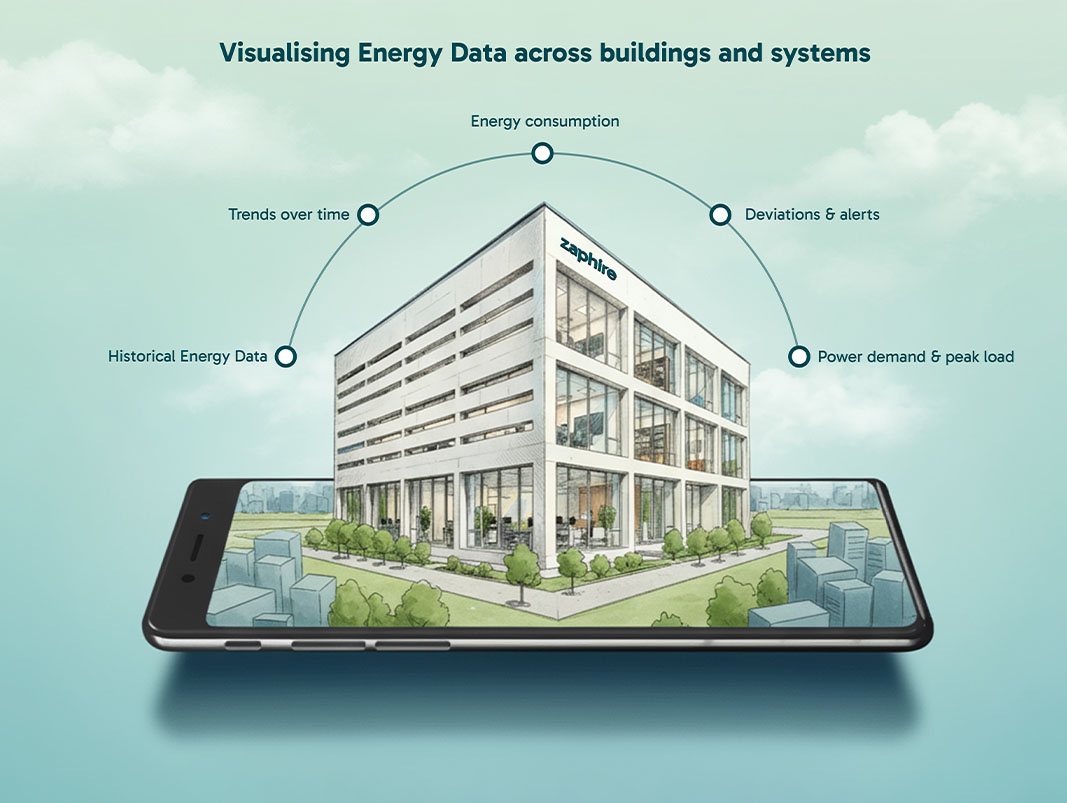
At this stage, visualisation plays a critical role in turning energy data into actionable insight. Clear graphs, dashboards and comparisons make the data understandable and actionable, even for decision-makers without a technical background. A well-designed EMS system transforms complex datasets into visual decision support.
Step 4: Use insights actively in operations and decision-making
To ensure continuous control, energy data must be used on an ongoing basis, not just reported retrospectively. In daily operations, energy data can enable deviation alerts, faster troubleshooting and more proactive energy management.
At a strategic level, the data can be used to prioritise the right energy efficiency measures, document the impact of investments, and support reporting related to ESG requirements and regulatory compliance. Energy data can also be used for long-term planning and optimisation, turning data into a management tool rather than merely an archive.
The role EMS systems play in visualisation and insight
Without the right systems, energy data often remains raw data - numbers that are difficult to interpret and use in practice. EMS systems (often referred to as EMS systems) therefore play a key role in transforming energy data into decision-ready information.
By collecting energy data in a single platform, structuring it automatically and presenting it visually, these systems provide continuous insight into energy consumption, deviations and trends. This enables faster action, better prioritisation of measures and ongoing monitoring of energy performance over time.
Technology that enables control and transparency
Successful energy management typically requires more than standalone meters and manual spreadsheets. Modern energy management is based on automated collection of energy data, ensuring that measurement values are gathered continuously without manual handling. The data should be consolidated in a single platform where analysis and visualisation provide a holistic overview across buildings, facilities and processes.
Furthermore, integrations with existing systems such as building management systems (BMS/SD), IoT platforms and other business systems are essential to put the data into the right context. In addition, organisations must choose scalable solutions that handle new measurement points, growing data volumes and future requirements. The right technology makes it possible to use this information as an active management tool in everyday operations, not just for periodic reports.
Ultimately, energy data in itself creates no value. It is only when the data is accurate, structured and actively used that it becomes a powerful tool. Organisations that succeed in this gain better control over costs, operations and sustainability.
Zaphire energy monitoring
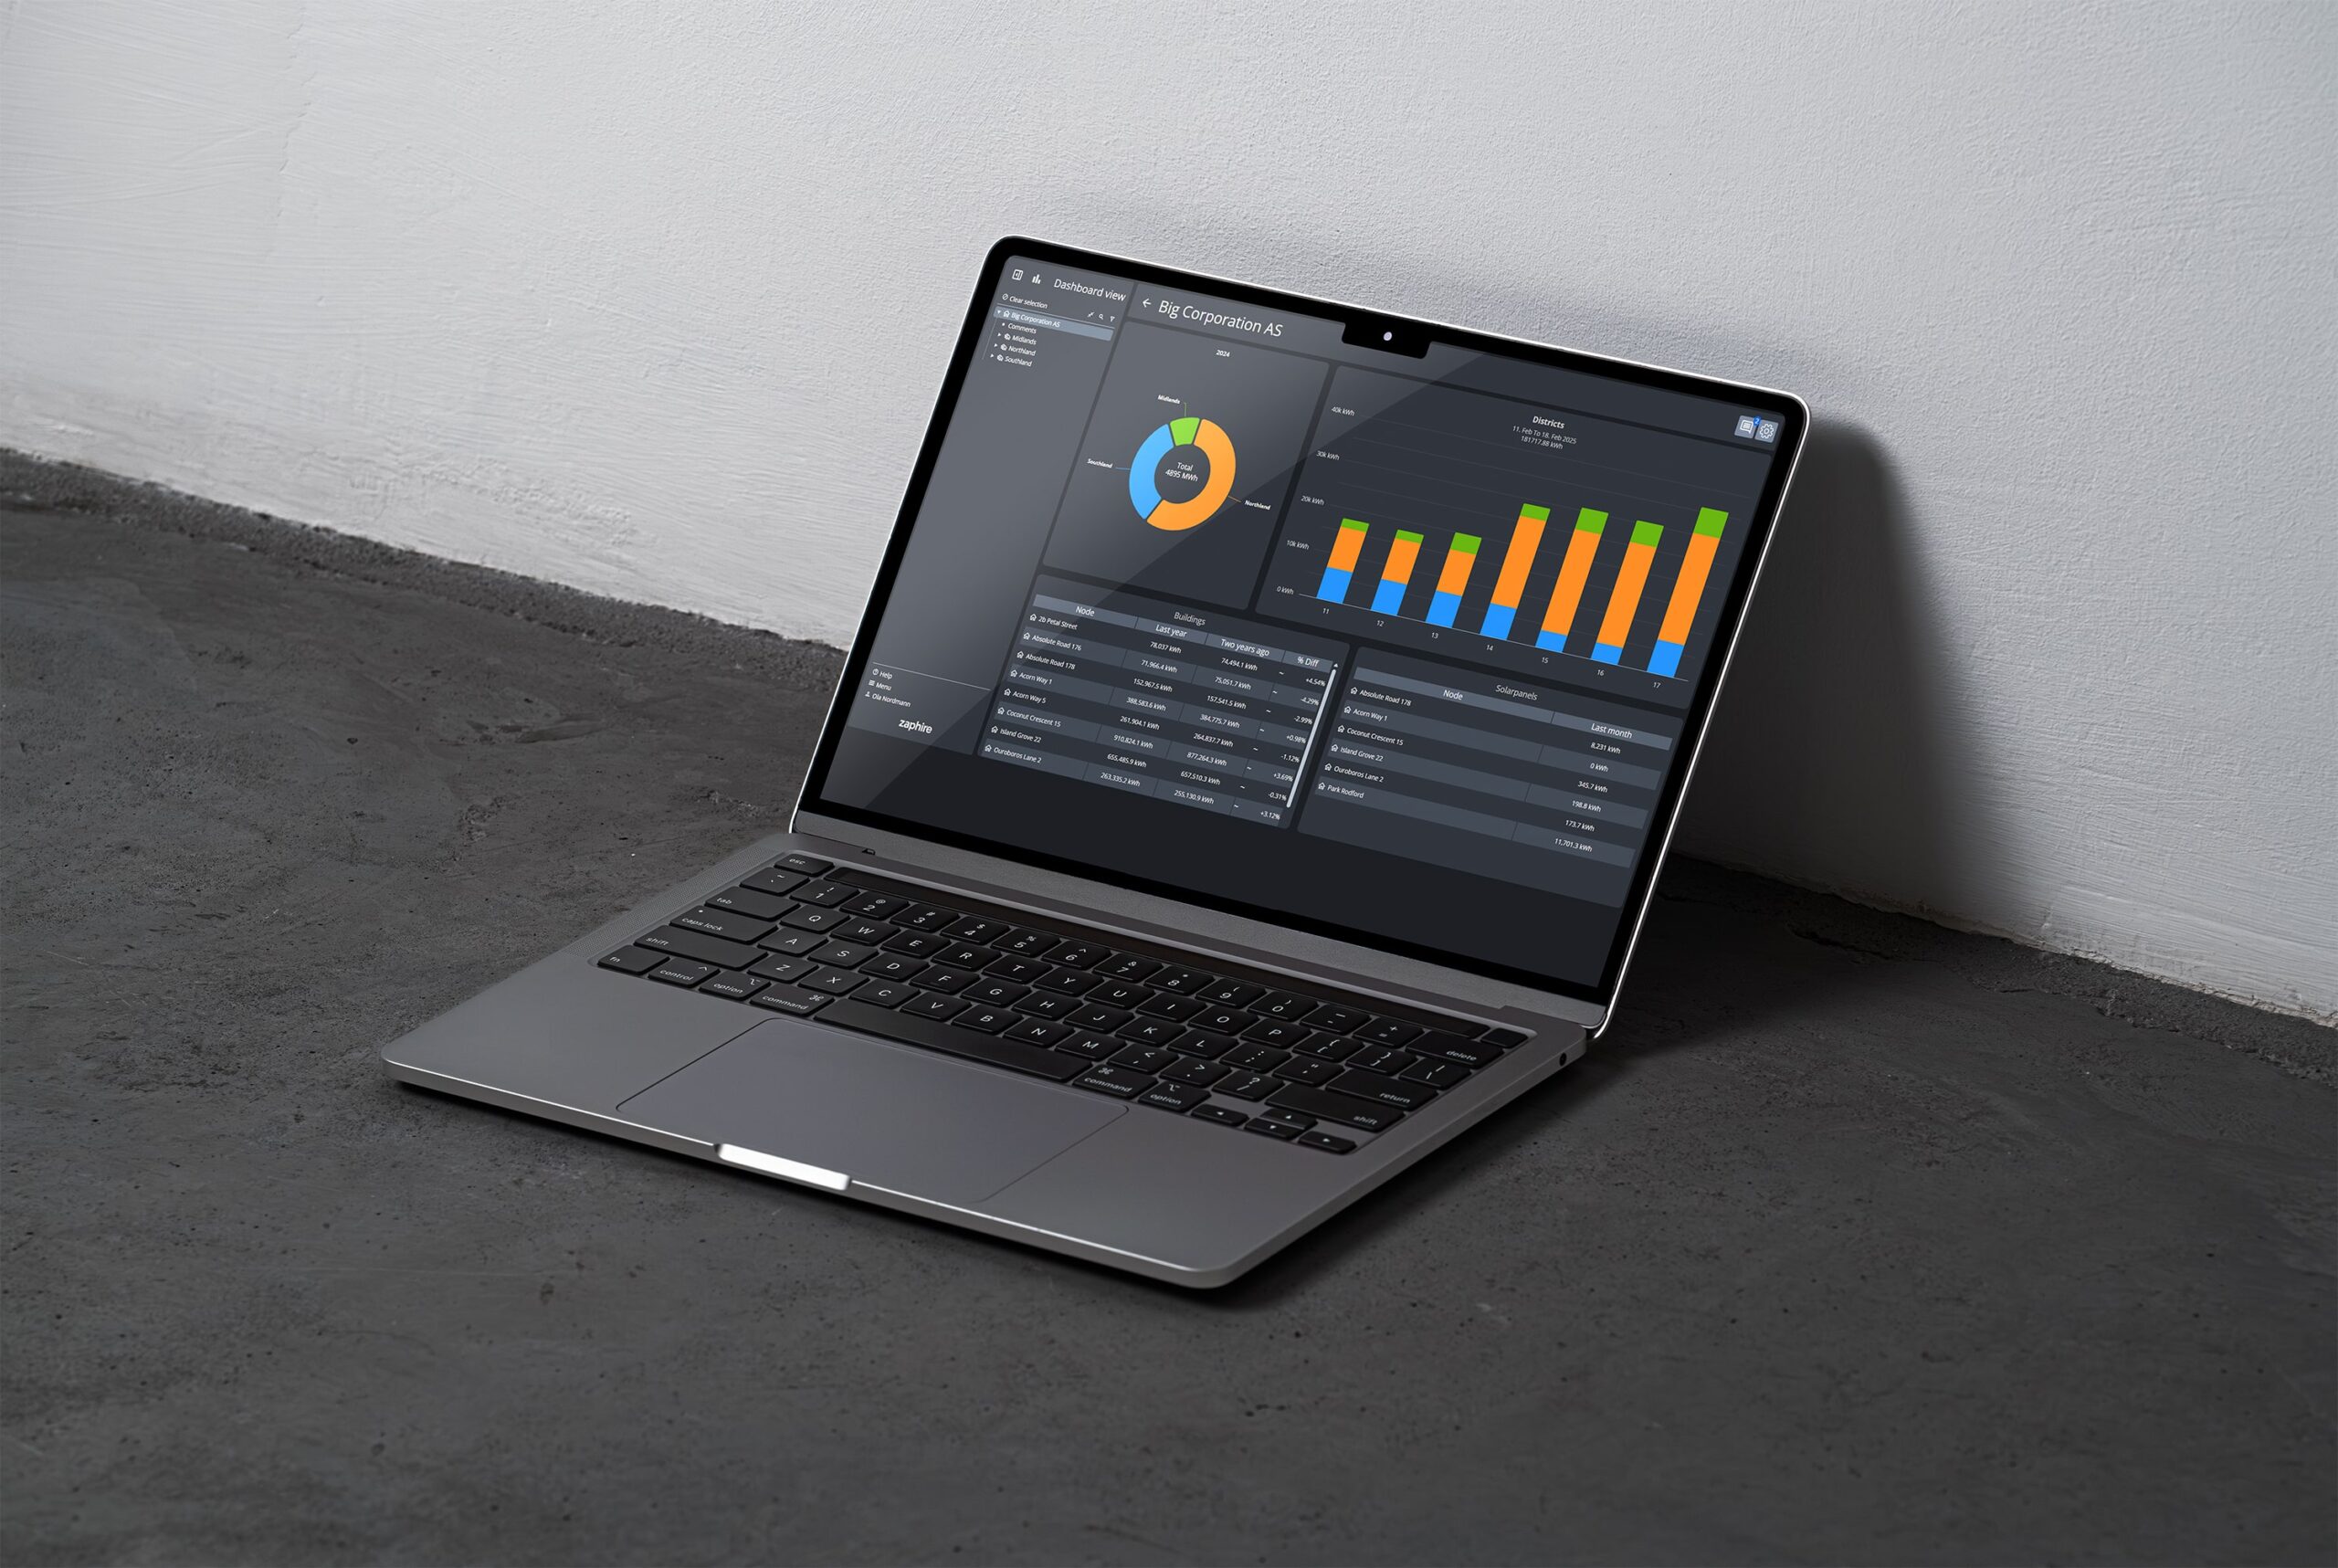
Zaphire EMS is a cloud-based energy monitoring system (EMS) developed to collect, structure and analyse energy data across buildings, facilities and technical installations. The solution continuously collects measurement values from energy meters, sensors and existing systems through open standards such as WebSockets and REST APIs, and consolidates the data in a central cloud-based database. This also enables seamless integration with existing building automation systems and third-party solutions. As a result, Zaphire EMS can be deployed on existing building automation infrastructure without major investment costs. All data access is secured through Zaphire’s Zero-Trust architecture, where no users or devices are granted implicit trust, ensuring secure handling of energy data in cloud-based building automation environments.
Within Zaphire EMS, raw energy data is normalised and presented in intuitive dashboards, charts and reports that provide a complete overview of energy consumption, deviations and trends. The system is accessible from anywhere via mobile, tablet or PC, giving decision-makers a solid, visual foundation to optimise energy use, identify improvement opportunities and document savings over time.