What is Weather Normalization?
Weather normalization is a method used to adjust energy consumption data so it reflects what a building or facility would have used under typical, long-term average weather conditions. By removing the impact of temperature extremes, weather normalization enables fair and accurate comparisons of energy performance across different months, years, and buildings.
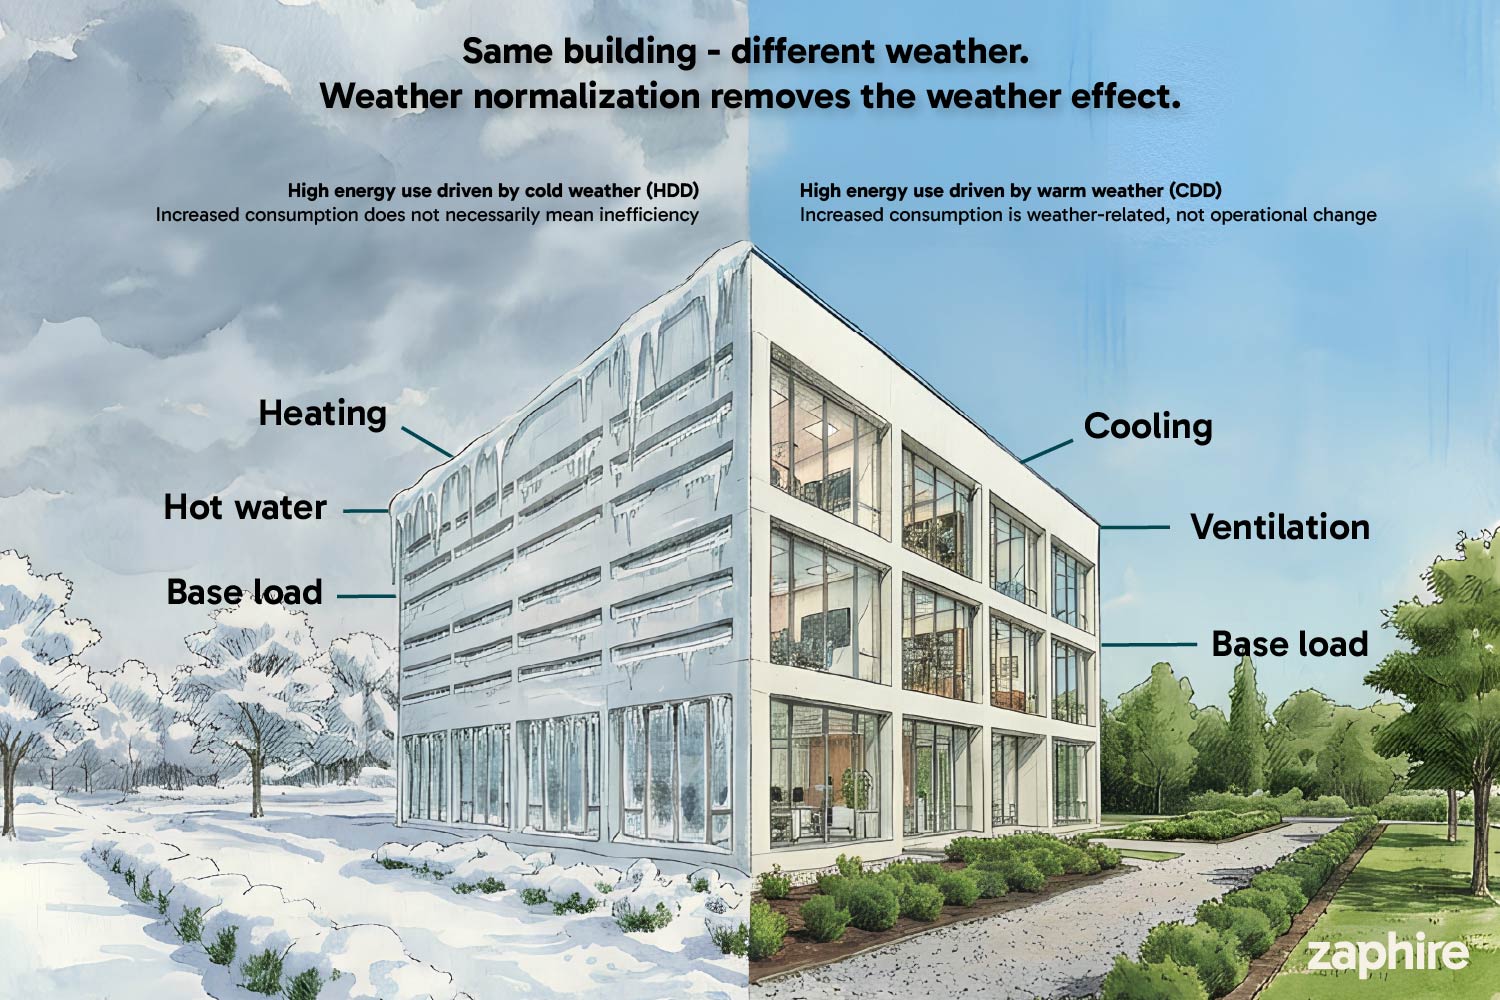
Outdoor temperature is one of the strongest external drivers of energy use. Heating demand rises during cold periods, while cooling demand increases during warm conditions. As a result, raw energy consumption data is often misleading when used on its own. A cold winter, a warm autumn, or an unexpected heatwave can inflate or reduce consumption figures, even if building operations remain unchanged.
For energy managers, facility owners, and organizations using an Energy Management System (EMS), weather normalization is essential for making data-driven decisions based on true operational performance rather than weather variability.
How Weather Normalization Improves Energy and Building Management Systems
Weather normalization removes the effect of unusual weather patterns from energy data. Instead of comparing consumption influenced by temperature extremes, energy use is recalculated as if every period experienced the same “normal” weather baseline.
This creates a consistent foundation for:
-
Evaluating energy efficiency initiatives
-
Tracking performance over time
-
Identifying operational issues
-
Supporting budgeting, forecasting, and compliance reporting
When integrated into a Building Management System (BMS) or Energy Management System (EMS), weather normalization ensures that trends reflect real operational changes, not seasonal distortions.
Why Weather Variations Distort Energy Consumption Data
Weather is one of the strongest external factors influencing a building’s energy use. Colder periods increase heating demand, while warmer conditions drive higher cooling consumption. Even small temperature variations can therefore cause significant fluctuations in energy data.
Unusual weather events, such as cold winters or heatwaves, can distort performance analysis. Higher energy use may appear to signal inefficiencies, while lower consumption can falsely suggest improvement, when both are simply weather-driven effects.
This makes direct comparisons between months or years unreliable without adjustment. Weather normalization removes this distortion by enabling fair, like-for-like assessment of energy performance, independent of temperature variability.
How Weather Normalization Works: The Core Principles
Weather normalization separates weather-dependent energy use from consumption that remains stable regardless of temperature. This is done by combining energy data with historical weather metrics - most commonly Heating Degree Days (HDD) and Cooling Degree Days (CDD) - to measure how energy use responds to outdoor conditions.
Using statistical modeling, the relationship between temperature and energy consumption is identified. This model makes it possible to estimate what energy use would have been under normal, long-term average weather conditions. Energy data is then adjusted to remove the impact of unusual weather. Periods affected by extreme heat or cold are corrected to a consistent weather baseline, enabling fair performance evaluation without temperature-related distortions.
The result is a clearer view of operational efficiency, making it easier to identify real improvements, uncover hidden issues, and compare performance across sites, time periods, and efficiency initiatives.
Key Metrics: HDD, CDD and Other Climate Indicators
Weather normalization relies on specific climate metrics that quantify how temperature conditions influence heating and cooling needs. The two most widely used indicators are Heating Degree Days (HDD) and Cooling Degree Days (CDD). These metrics translate daily temperature data into a form that directly reflects energy demand.
Heating Degree Days (HDD) measure how much and how long the outdoor temperature stays below a defined base temperature, often around 18°C, depending on regional standards. The colder it is, and the further the temperature drops below this threshold, the higher the HDD value becomes. This makes HDD a strong indicator of heating demand.
Cooling Degree Days (CDD) operate on the same principle but in the opposite direction. When temperatures rise above the base level, CDD values increase, indicating a need for cooling. Buildings in warmer climates typically accumulate higher CDD values, while colder regions see more HDD.
Although HDD and CDD are the foundational metrics, additional climate factors can also play a meaningful role in certain contexts:
-
Humidity levels, which influence perceived indoor temperature and cooling loads
-
Solar radiation, which affects heat gain through windows and building surfaces
-
Wind speed, which impacts heat loss in poorly insulated structures
While these secondary indicators are not always used in standard normalization models, they can enhance accuracy for complex buildings or specialized energy analyses. Together, HDD, CDD, and supplementary climate data form the backbone of weather normalization. They provide a quantifiable way to connect real-world weather patterns with energy demand, ensuring that adjustments are based on objective and measurable conditions.
Weather Normalization Calculation: Step-by-Step Methodology
Although weather normalization can be implemented using advanced statistical tools, the underlying methodology follows a logical and structured process. The goal is always the same: to estimate what a building’s energy use would have been under typical weather conditions, so performance can be compared fairly over time.
1. Gather Historical Energy and Weather Data
The process begins by collecting historical data for both energy consumption and weather over the same time periods. This includes actual energy use measured on an hourly, daily, or monthly basis, as well as corresponding temperature data, typically expressed as Heating Degree Days (HDD) and Cooling Degree Days (CDD). For greater accuracy, several years of data are usually included to capture a wide range of weather conditions.
2. Identify the Relationship Between Weather and Energy Use
Next, the relationship between weather and energy consumption is analyzed. This is commonly done using a statistical model, such as a regression analysis, to determine how strongly heating and cooling energy use is correlated with HDD and CDD. This step helps identify the building’s base load, which is the portion of energy use that is independent of outdoor temperature, and the weather-sensitive portion of consumption.
3. Establish a Normal Weather Baseline
To normalize energy data, a reference for typical weather conditions must be defined. This is usually based on a long-term average, such as a 10- or 30-year climate normal for the building’s location. This baseline represents what “normal” weather looks like and serves as the foundation for weather normalization.
4. Apply the Model to Normalize Energy Consumption
Once the model and the normal weather baseline are established, energy consumption for each period is recalculated as if it had experienced normal weather conditions rather than the actual ones. Heating-related energy use is adjusted based on normal HDD values, cooling-related energy use is adjusted based on normal CDD values, and the base load is retained since it is not affected by temperature.
5. Compare Actual vs. Weather-Normalized Consumption
The normalized results produce a corrected energy profile in which variations caused by unusual weather have been removed. This makes it possible to clearly distinguish between real operational changes, differences driven purely by temperature, and the impacts of energy efficiency measures.
6. Use Normalized Data for Reporting, Benchmarking, and Analysis
Finally, the weather-normalized dataset becomes a valuable tool for reporting, benchmarking, and decision-making. It supports year-over-year performance comparisons, measurement and verification of energy savings (M&V), budgeting and forecasting, carbon reporting and compliance, and the identification of operational inefficiencies. By following this structured approach, organizations gain a clearer and more reliable understanding of true building performance, independent of weather variability.
How Weather Normalization Enhances the Value of an Energy Management System
When weather normalization is built into an Energy Management System (EMS), it becomes a powerful tool for transforming raw consumption data into meaningful, actionable insights. An EMS depends on accurate trend analysis, fair comparisons, and reliable performance tracking, yet all of these can be distorted by unpredictable temperature variations. Weather normalization removes this noise, allowing the system to present a clearer picture of true operational performance.
By automatically adjusting energy data to reflect typical weather conditions, the EMS enables energy managers to:
-
Identify real efficiency improvements instead of weather-driven fluctuations
-
Evaluate the impact of energy-saving measures with greater confidence
-
Benchmark buildings and periods accurately across different climates or seasons
-
Produce more reliable budgets, forecasts, and long-term plans
-
Strengthen ESG and sustainability reporting with consistent, comparable metrics
With weather-normalized data, the EMS becomes far more than a monitoring tool. It becomes a decision-support platform that reveals underlying trends, uncovers hidden inefficiencies, and highlights opportunities for improvement, regardless of how extreme or unpredictable the weather may be. For organizations seeking to reduce costs, improve performance, and operate more sustainably, weather normalization is a critical component of a modern, data-driven Energy Management System.
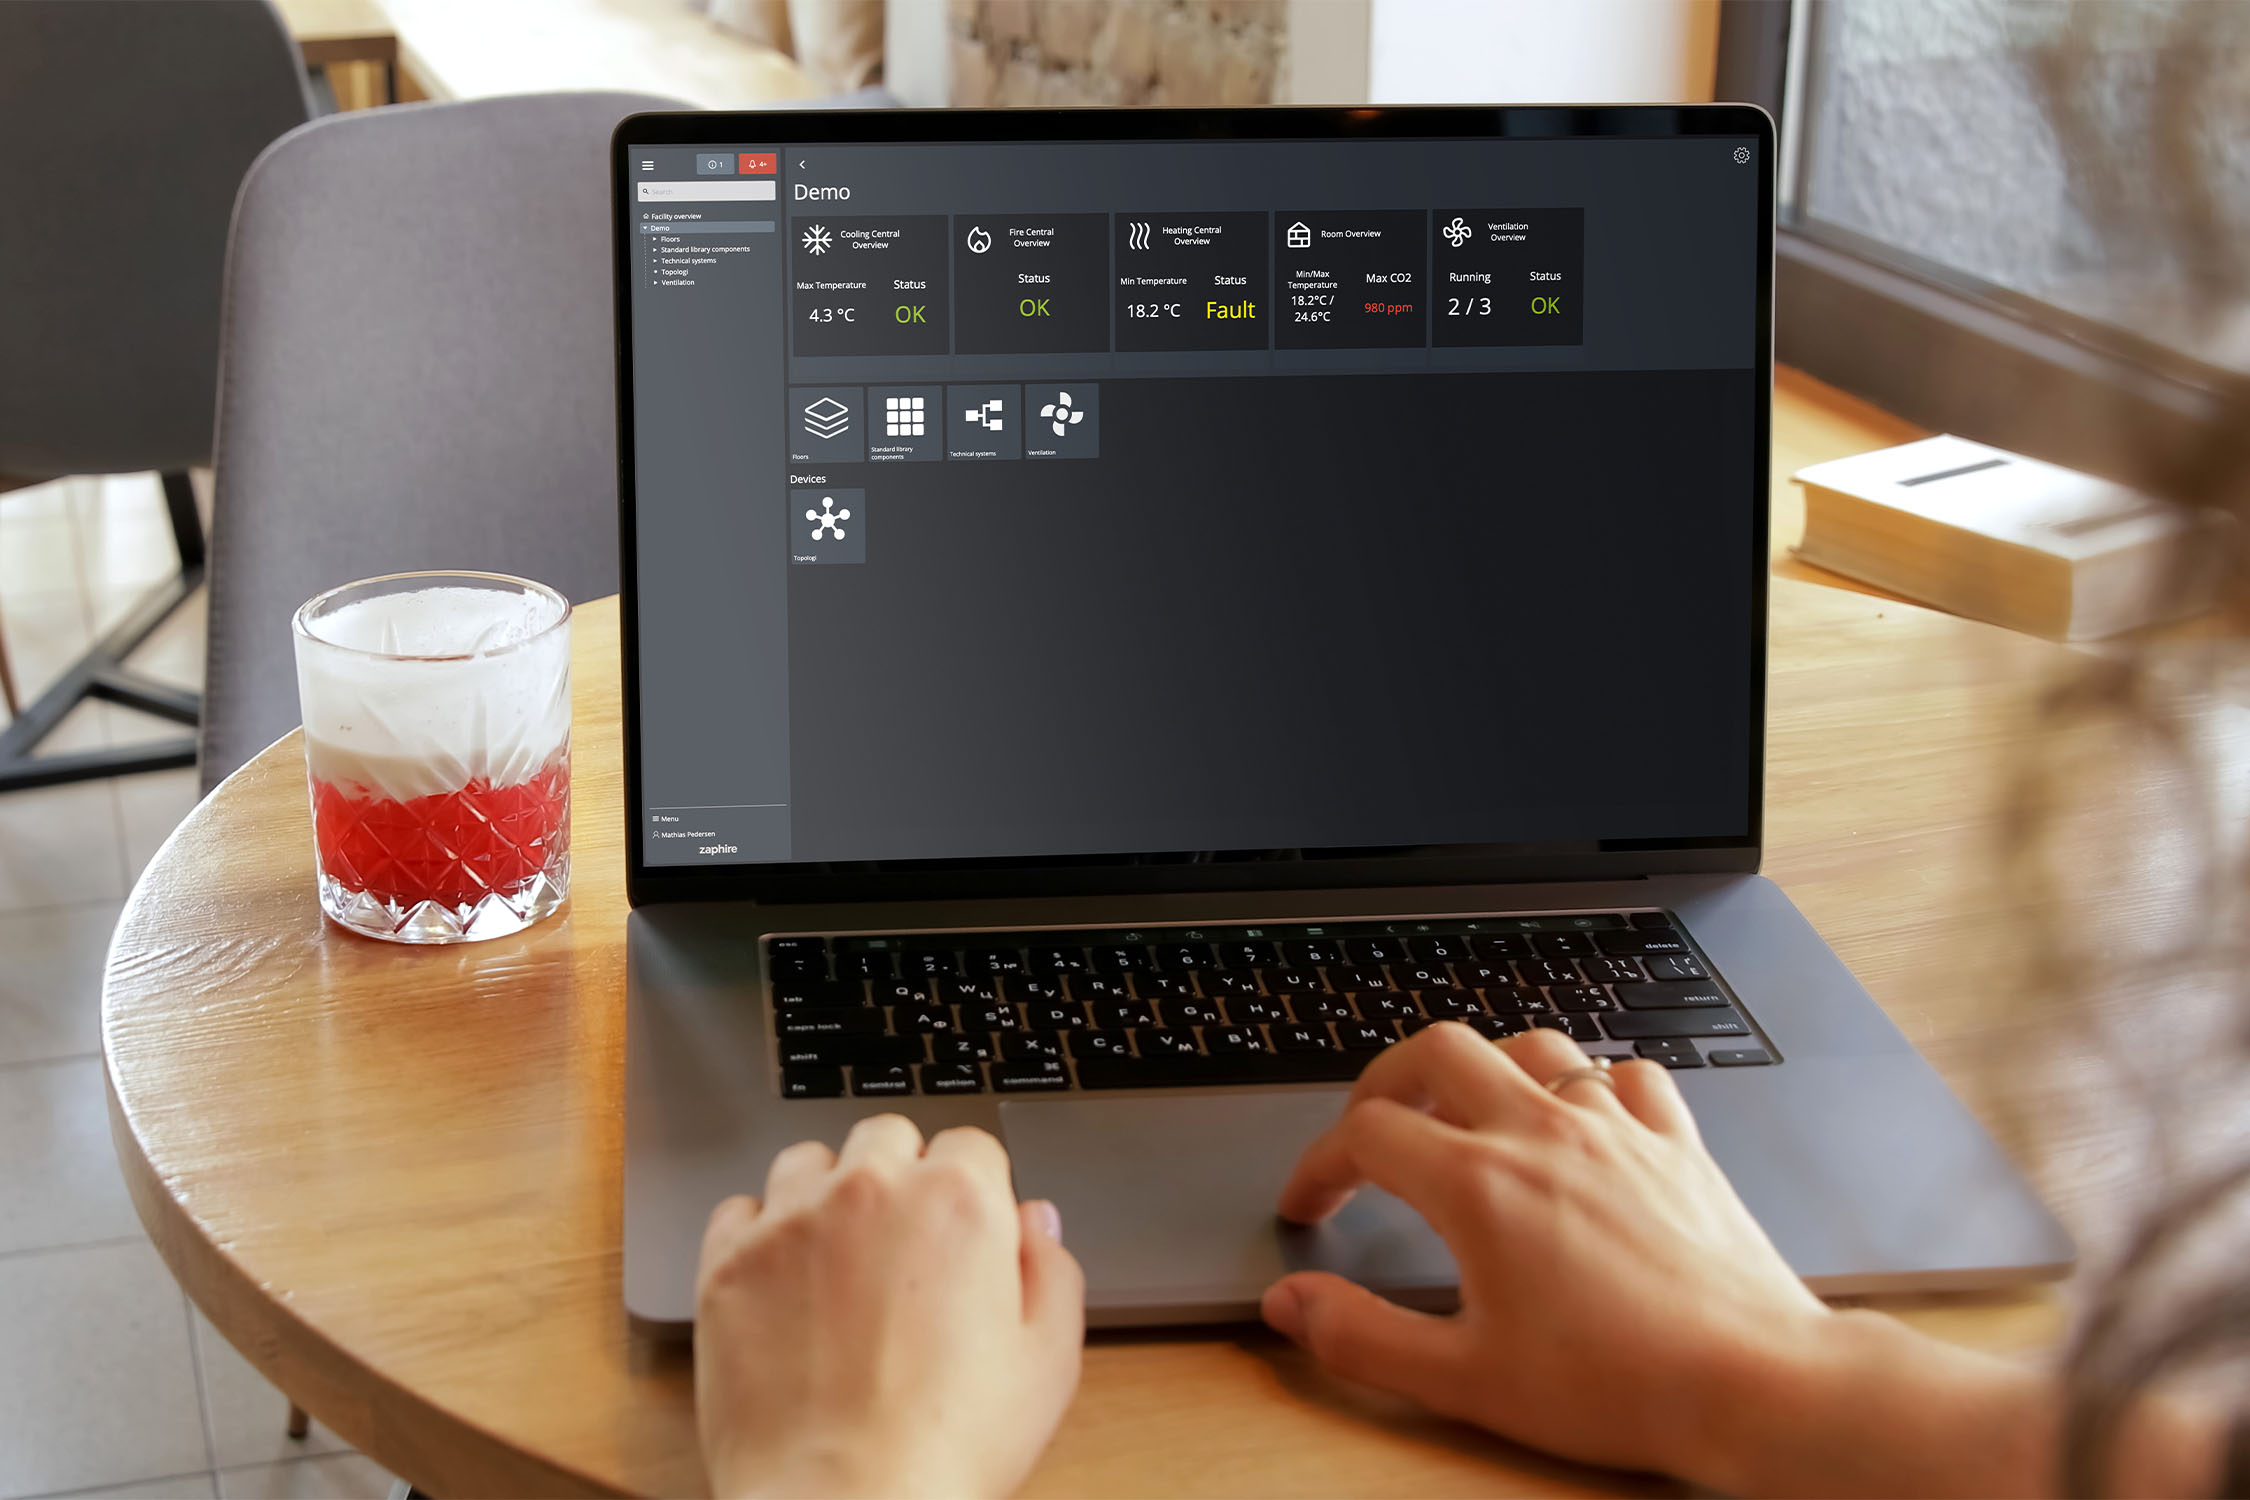
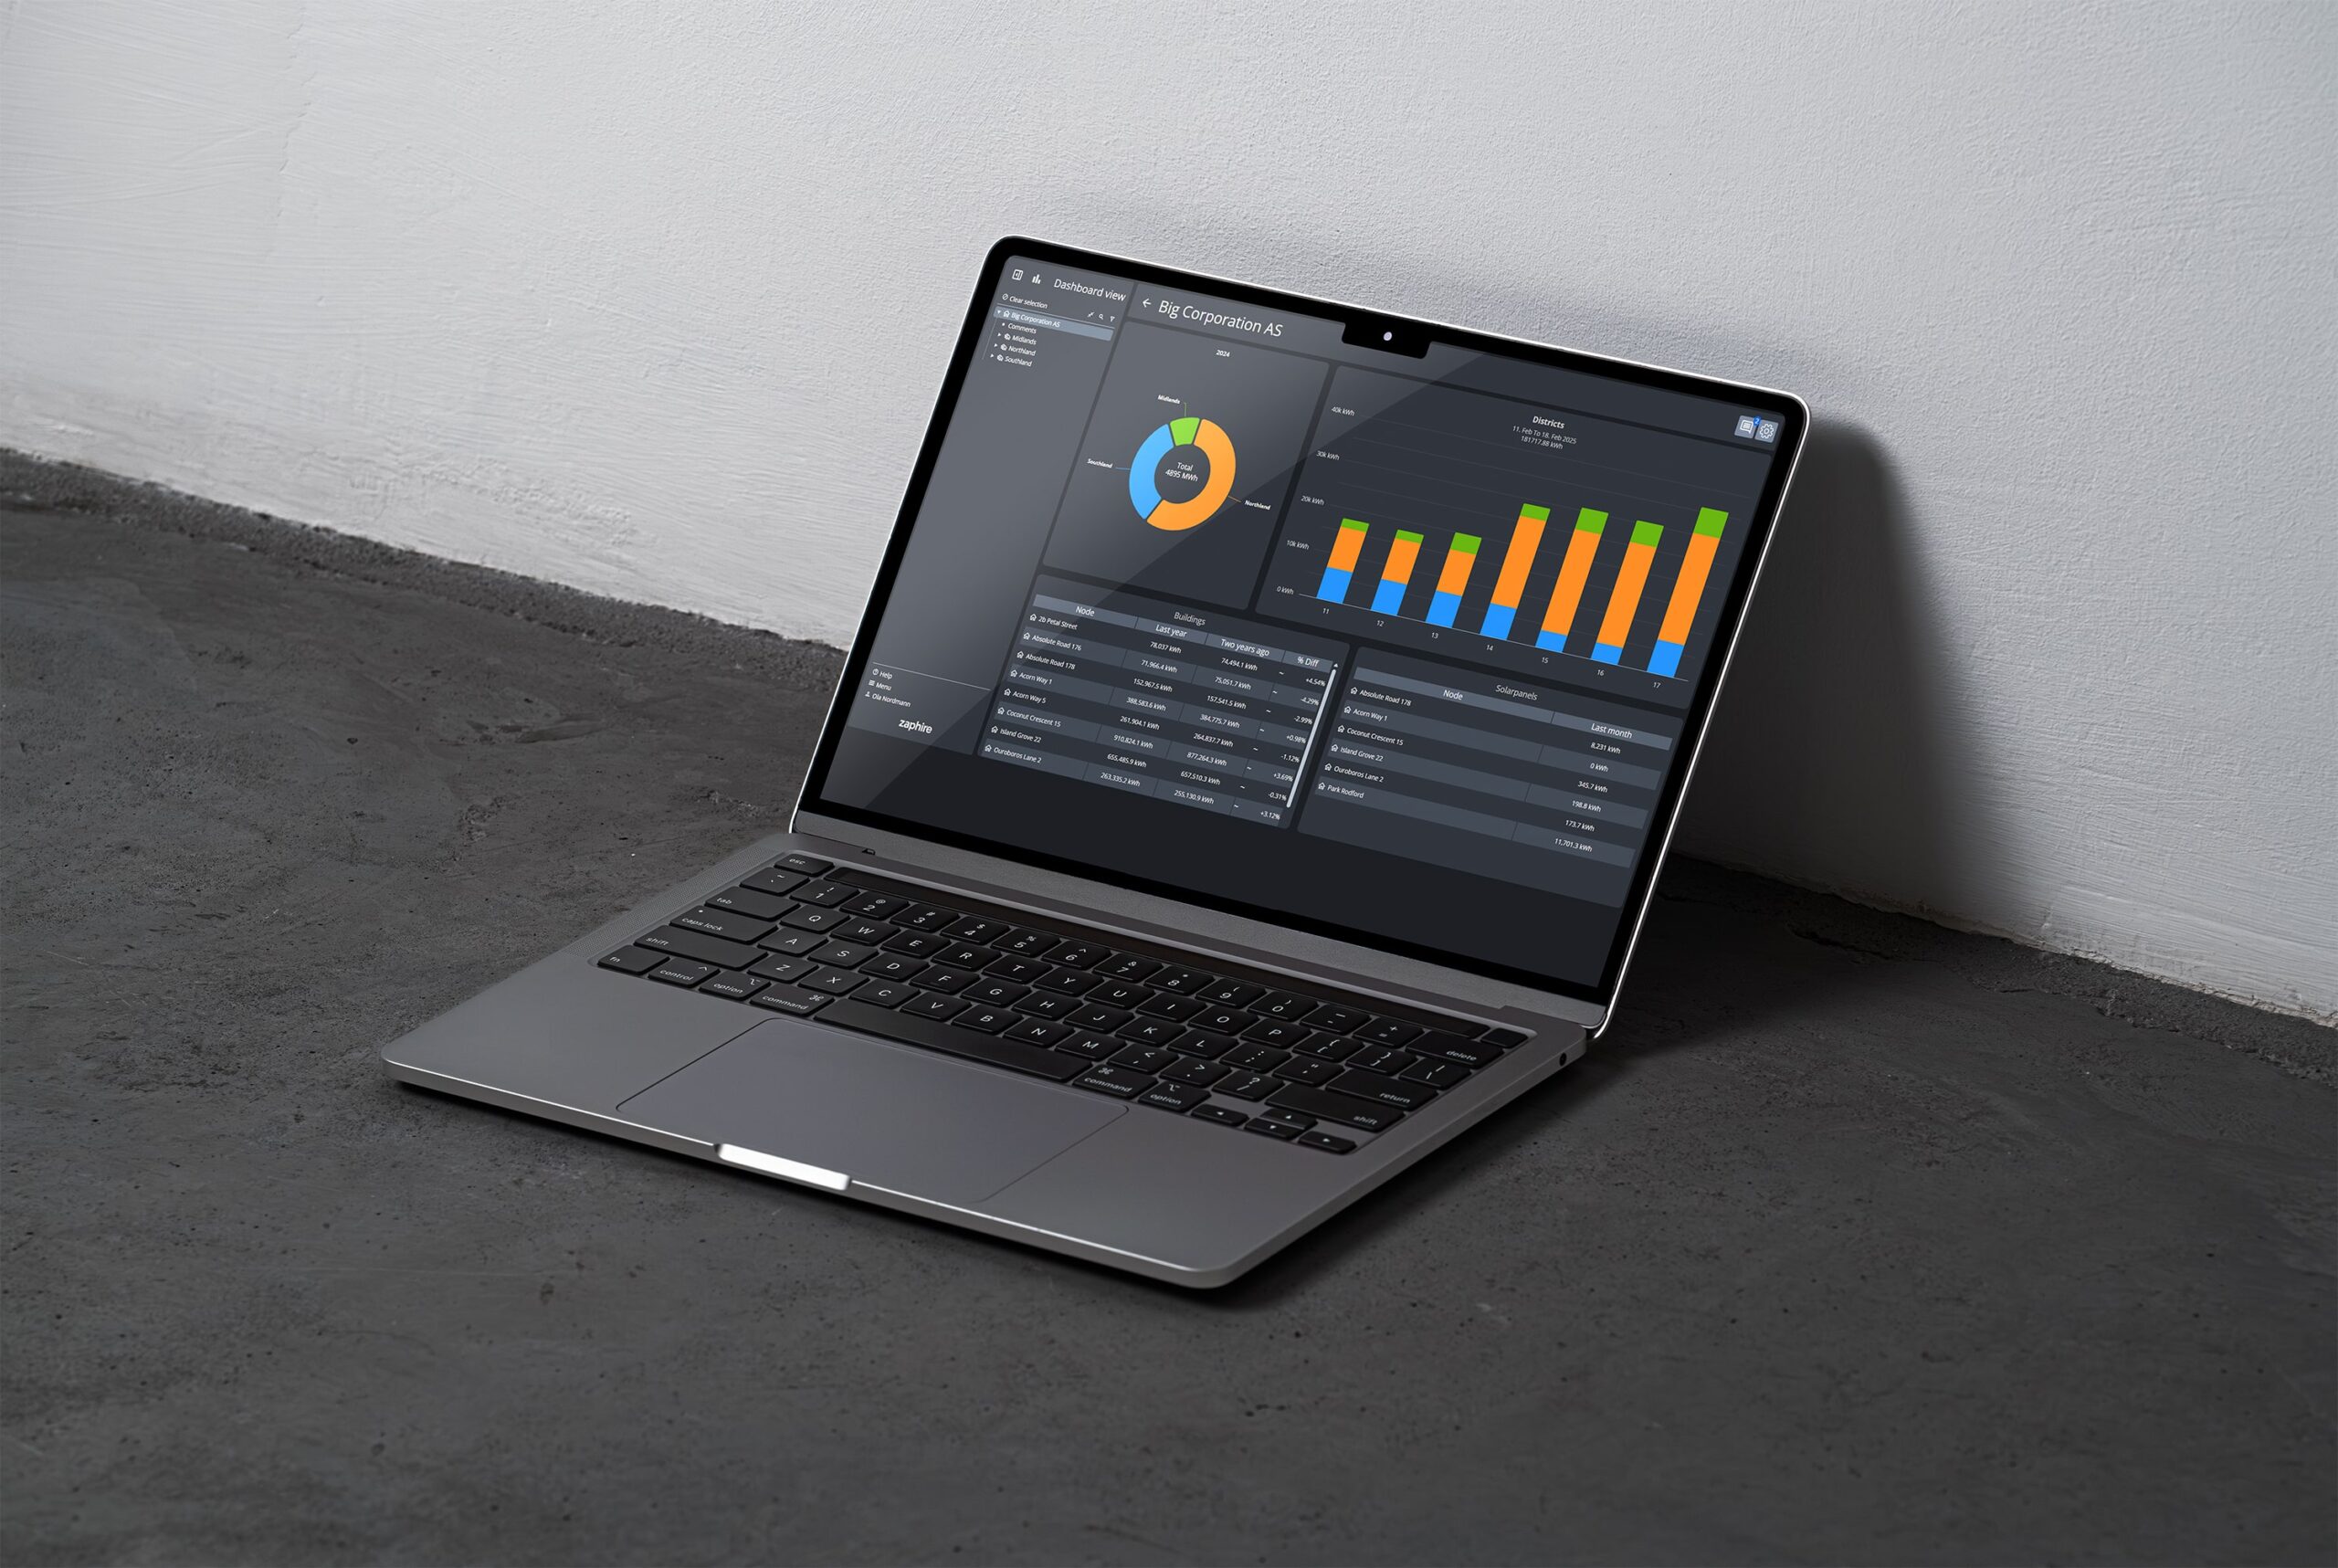
Weather Normalization in Zaphire
Zaphire EMS uses ET charts as a historical lens to understand how energy systems respond to changing weather conditions. By analyzing past patterns in demand, pricing, and grid behavior, Zaphire helps customers see clear relationships between weather events and energy use over time. These insights support more informed planning, improved forecasting, and smarter operational decisions, turning historical weather-driven data into practical guidance for future energy strategies.